Ingestion and Quality Control metrics generation
Pipeline steps for all modalities
Panpipes ingest loads and concatenates data from a variety of filetype inputs.
Panpipes creates a mudata object containing the data in assays called ‘rna’, ‘prot’, ‘atac’, and ‘rep’. See the mudata documentation for more details on interactively accessing these data.
Feature names will be forced to be unique. This means that protein assay names will be prefixed with ‘prot_’
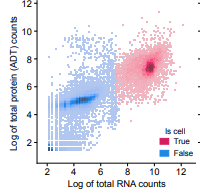
Then qc metrics are computed using scanpy.pp.calculated_qc_metrics. Total counts per cell and total features per cell, are computed as standard, but the gene scores are completely customisable as described in the gene list format page. These metrics are plotted as violin plots, and scatters.
RNA QC steps
Per cell QC metrics computed, optionally providing custom gene lists for calculation (see Using custom genes annotations: gene list formats)
Doublet scores are computed with scrublet
cell cycle phases is inferred per cell with sc.tl.score_genes_cell_cycle
Prot QC steps
Protein metadata such as isotype status or shorter names incorporated into the object. Inputs for this are described [here]
Per cell QC metrics computed as described above, including pct_isotype where isotype information is available.
Per Protein metrics, total_counts, and are computed, in order to compare the binding of different antibodies (applicable when your assay is CITE-seq based). These are defined in the yml:
plot_metrics_per_prot: total_counts,log1p_total_counts,n_cells_by_counts,mean_countsA rudimentary check for cells that are ‘isotype’ outliers, i.e. the cells where the isotype content is in the top 10% quantile for more than 2 isotypes. (these parameters are customisable in the
pipeline.yml). See the function here.
# isotype outliers: one way to determine which cells are very sticky is to work out which cells have the most isotype UMIs
# associated to them, to label a cell as an isotype outlier, it must meet or exceed the following crietria:
# be in the above x% quantile by UMI counts, for at least n isotypes
# (e.g. above 90% quantile UMIs in at least 2 isotypes)
identify_isotype_outliers: True
isotype_upper_quantile: 90
isotype_n_pass: 2
Finally, the normalisation is assessed on a per channel basis (default: the sample_id column). This is either CLR or DSB normalisation. Importantly this normalised data is not saved in the mudata object, by default it is just visualised. It’s purpose is to check that the staining has been consistent across your channels and whether there are prominent batch effects. The normalised data can be saved by setting
save_norm_prot_mtxto True, and each normalised channel with be saved separately as mtx files.
ATAC QC steps
QC for ATAC includes some modality specific metrics computation, namely:
Percent fragments in peaks
Number of mitochondrial reads per cell
TSS (transcription start site) enrichment is computed with mu.atac.tl.tss_enrichment
Please note that panpipes ingest expects that you have concatenated your multiome samples and so expects one multiome sample at the time, since concatenating different peak-callings may result in unwanted artefacts. Please check the cellranger documentation on how to aggregate multiple atac runs before using panpipes.
Repertoire (Rep) QC Steps
Using the scirpy library (v.0.12.0), the chains are qc’d with scirpy.tl.chain_qc
Clonotypes are defined with scirpy.pp.ir_dist and scirpy.tl.define_clonotypes and scirpy.tl.clonal_expansion
Assessing background
There is an additional optional assess_background step, if the raw data (includeing empty drops) is available. This is primarily of use when you have RNA and Protein modalities.
plot the barcode rank plots for each sample_id (rna modality).
scatter plots to compare distributions of foreground and background of rna and prot
quantify and plot the top expressed features (rna and prot) in the empty droplets. This can reveal potential contamination and batch effects in your data.
Steps to run
Generate sample submission file as described in Inputs to Multimodal QC pipeline
Generate or supply qc genelists as described in Gene list format
For prot assay - generate the protein metadata file example. This file is integrated into the mdata[‘prot’].var slot.
Generate config file (
panpipes ingest config)Edit the pipeline.yml file for your dataset
this is explained step by step within the pipeline.yml file
Run complete qc pipeline with
panpipes ingest make fullUse outputs to decide filtering thresholds.
Note that the actual filtering occurs in the first step of Preprocess pipeline
The h5mu file outputted from ingest contains concatenated raw counts
from all samples in the submission file, plus qc metrics are computed,
and these qc metrics are visualised in a variety of plots to aid the
user to determine data quality and filtering thresholds.